|
|
|
|

|
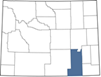
| Albany County |
Department
of Administration & Information
Economic Analysis Division |
|
| Land Area (square
mile): 4,308.8 |
|
|
|
|
| Population Per Square
Mile: 8.7 |
|
|
|
|
|
|
|
|
Albany |
Percent |
Wyoming |
Percent |
| POPULATION - AGE/SEX1 |
|
|
|
|
| Total |
37,608 |
100.0 |
578,803 |
100.0 |
| Male |
19,625 |
52.2 |
296,214 |
51.2 |
| Female |
17,983 |
47.8 |
282,589 |
48.8 |
| |
|
|
|
|
| Under 5 years |
1,653 |
4.4 |
32,291 |
5.6 |
| 5 to 9 years |
1,663 |
4.4 |
36,454 |
6.3 |
| 10 to 14 years |
1,666 |
4.4 |
39,984 |
6.9 |
| 15 to 19 years |
3,281 |
8.7 |
38,231 |
6.6 |
| 20 to 24 years |
7,806 |
20.8 |
37,645 |
6.5 |
| 25 to 29 years |
3,389 |
9.0 |
35,461 |
6.1 |
| 30 to 34 years |
2,437 |
6.5 |
38,105 |
6.6 |
| 35 to 39 years |
2,213 |
5.9 |
39,816 |
6.9 |
| 40 to 44 years |
1,987 |
5.3 |
37,116 |
6.4 |
| 45 to 49 years |
1,658 |
4.4 |
32,116 |
5.5 |
| 50 to 54 years |
1,554 |
4.1 |
32,239 |
5.6 |
| 55 to 59 years |
1,571 |
4.2 |
35,141 |
6.1 |
| 60 to 64 years |
1,846 |
4.9 |
40,327 |
7.0 |
| 65 to 69 years |
1,824 |
4.9 |
37,010 |
6.4 |
| 70 to 74 years |
1,387 |
3.7 |
28,976 |
5.0 |
| 75 to 79 years |
789 |
2.1 |
17,433 |
3.0 |
| 80 to 84 years |
509 |
1.4 |
10,734 |
1.9 |
| 85 years and over |
375 |
1.0 |
9,724 |
1.7 |
| |
|
|
|
|
| Under 18 years |
5,998 |
15.9 |
132,424 |
22.9 |
| 18 to 24 years |
10,071 |
26.8 |
52,181 |
9.0 |
| 25 to 44 years |
10,026 |
26.7 |
150,498 |
26.0 |
| 45 to 64 years |
6,629 |
17.6 |
139,823 |
24.2 |
| 65 years and over |
4,884 |
13.0 |
103,877 |
17.9 |
| |
|
|
|
|
| Median age (years) |
28.9 |
(X) |
38.9 |
(X) |
| |
|
|
|
|
| POPULATION -
RACE/HISPANIC1 |
| All
Races Combined |
37,608 |
100.0 |
578,803 |
100.0 |
| White Alone |
34,155 |
90.8 |
534,669 |
92.4 |
| Black or African American Alone |
581 |
1.5 |
7,087 |
1.2 |
| American Indian and Alaska Native Alone |
495 |
1.3 |
16,435 |
2.8 |
| Asian Alone |
1,300 |
3.5 |
6,329 |
1.1 |
| Native Hawaiian and Other Pacific
Islander Alone |
53 |
0.1 |
586 |
0.1 |
| Two or More Races |
1,024 |
2.7 |
13,697 |
2.4 |
| |
|
|
|
|
| Hispanic
(may be of any race) |
3,822 |
10.2 |
61,087 |
10.6 |
| Non-Hispanic |
33,786 |
89.8 |
517,716 |
89.4 |
| White Alone |
30,898 |
82.2 |
482,320 |
83.3 |
| |
|
|
|
|
| COMPONENTS
OF POPULATION CHANGE1 |
| Total
Population Change |
529 |
100.0 |
1,536 |
100.0 |
| Natural Change |
95 |
18.0 |
171 |
11.1 |
| Births |
351 |
(X) |
6,213 |
(X) |
| Deaths |
256 |
(X) |
6,042 |
(X) |
| Net Migration |
431 |
81.5 |
1,368 |
89.1 |
| |
|
|
|
|
| HOUSEHOLDS
BY TYPE2 |
| Total
households |
16,016 |
100.0 |
230,653 |
100.0 |
| Married-couple family |
6,135 |
38.3 |
117,873 |
51.1 |
| With own children under 18
years |
2,430 |
15.2 |
45,198 |
19.6 |
| Cohabitating couple |
1,440 |
9.0 |
15,846 |
6.9 |
| With own children under 18
years |
171 |
1.1 |
4,974 |
2.2 |
| Male householder, no spouse/partner
present |
4,301 |
26.9 |
45,489 |
19.7 |
| With own children under 18
years |
153 |
1.0 |
3,258 |
1.4 |
| Householder living alone |
2,630 |
16.4 |
34,498 |
15.0 |
| 65 years and over |
656 |
4.1 |
10,822 |
4.7 |
| Female householder, no spouse/partner
present |
4,140 |
25.8 |
51,445 |
22.3 |
| With own children under 18
years |
374 |
2.3 |
8,701 |
3.8 |
| Householder living alone |
2,380 |
14.9 |
34,175 |
14.8 |
| 65 years and over |
776 |
4.8 |
16,806 |
7.3 |
| |
|
|
|
|
| Households with one or more people under 18
years |
3,294 |
20.6 |
67,134 |
29.1 |
| Households with one or more people 65 years
and over |
3,410 |
21.3 |
68,663 |
29.8 |
| |
|
|
|
|
| Average
household size |
2.2 |
(X) |
2.44 |
(X) |
| Average
family size |
2.8 |
(X) |
3.05 |
(X) |
| |
|
|
|
|
| PRESENCE AND
TYPES OF INTERNET SUBSCRIPTIONS IN HOUSEHOLD2 |
| Total |
16,016 |
100.0 |
230,653 |
100.0 |
| With an Internet subscription |
14,390 |
89.8 |
201,811 |
87.5 |
| Dial-up with no other type of
Internet subscription |
25 |
0.2 |
505 |
0.3 |
| Broadband of any type |
14,365 |
99.8 |
201,306 |
99.7 |
| Internet access without a subscription |
897 |
5.6 |
7,195 |
3.1 |
| No Internet access |
729 |
4.6 |
21,647 |
9.4 |
|
|
|
|
|
| EDUCATIONAL
ATTAINMENT2 |
| Population
25 years and over |
21,286 |
100.0 |
390,162 |
100.0 |
| Less than 9th grade |
272 |
1.3 |
7,049 |
1.8 |
| 9th to 12th grade, no diploma |
607 |
2.9 |
17,384 |
4.5 |
| High school graduate (includes
equivalency) |
3,068 |
14.4 |
110,950 |
28.4 |
| Some college, no degree |
3,777 |
17.7 |
98,346 |
25.2 |
| Associate's degree |
1,586 |
7.5 |
45,150 |
11.6 |
| Bachelor's degree |
6,054 |
28.4 |
69,809 |
17.9 |
| Graduate or professional degree |
5,922 |
27.8 |
41,474 |
10.6 |
| |
|
|
|
|
| Percent
high school graduate or higher |
(X) |
95.9 |
(X) |
93.7 |
| Percent
bachelor's degree or higher |
(X) |
56.3 |
(X) |
28.5 |
| |
|
|
|
|
| VETERAN
STATUS2 |
| Civilian
population 18 years and over |
31,273 |
100.0 |
438,739 |
100.0 |
| Civilian veterans |
1,898 |
6.1 |
43,326 |
9.9 |
| |
|
|
|
|
| DISABILITY
STATUS2 |
| Civilian
noninstitutionalized population |
37,145 |
100.0 |
567,043 |
100.0 |
| With a disability |
3,704 |
10.0 |
75,942 |
13.4 |
| |
|
|
|
|
| RESIDENCE 1
YEAR AGO2 |
| Population
age 1 year and over |
37,008 |
100.0 |
570,368 |
100.0 |
| Same house |
24,691 |
66.7 |
478,106 |
83.8 |
| Different house in the U.S. |
12,021 |
32.5 |
90,237 |
15.8 |
| Same county |
6,419 |
17.3 |
50,168 |
8.8 |
| Different county |
5,602 |
15.1 |
40,069 |
7.0 |
| Same state |
2,058 |
5.6 |
13,934 |
2.4 |
| Different state |
3,544 |
9.6 |
26,135 |
4.6 |
| Abroad |
296 |
0.8 |
2,025 |
0.4 |
| |
|
|
|
|
| PLACE OF
BIRTH2 |
| Total
Population |
37,311 |
100.0 |
576,641 |
100 |
| Native |
34,775 |
93.2 |
556,981 |
96.6 |
| Born in United States |
34,606 |
92.8 |
552,038 |
95.7 |
| Born in Wyoming |
13,603 |
36.5 |
246,847 |
42.8 |
| Born in different state |
21,003 |
56.3 |
305,191 |
52.9 |
| Born in Island areas or abroad to
American parents |
169 |
0.5 |
4,943 |
0.9 |
| Foreign born |
2,536 |
6.8 |
19,660 |
3.4 |
| Naturalized U.S. citizen |
696 |
1.9 |
7,805 |
1.4 |
| Not a U.S. citizen |
1,840 |
4.9 |
11,855 |
2.1 |
| |
|
|
|
|
| INCOME AND BENEFITS (IN 2021 INFLATION-ADJUSTED DOLLARS)2 |
| Total
households |
16,016 |
100.0 |
230,653 |
100.0 |
| Less than $10,000 |
1,559 |
9.7 |
11,557 |
5.0 |
| $10,000 to $14,999 |
776 |
4.8 |
8,523 |
3.7 |
| $15,000 to $24,999 |
1,885 |
11.8 |
17,551 |
7.6 |
| $25,000 to $34,999 |
1,649 |
10.3 |
20,163 |
8.7 |
| $35,000 to $49,999 |
2,032 |
12.7 |
25,694 |
11.1 |
| $50,000 to $74,999 |
2,491 |
15.6 |
42,022 |
18.2 |
| $75,000 to $99,999 |
1,419 |
8.9 |
33,153 |
14.4 |
| $100,000 to $149,999 |
2,451 |
15.3 |
42,133 |
18.3 |
| $150,000 to $199,999 |
1,063 |
6.6 |
16,818 |
7.3 |
| $200,000 or more |
691 |
4.3 |
13,039 |
5.7 |
| Median household income (dollars) |
$50,733 |
(X) |
$68,002 |
(X) |
| Mean household income (dollars) |
$71,743 |
(X) |
$87,786 |
(X) |
| |
|
|
|
|
| With earnings |
13,614 |
85.0 |
181,096 |
78.5 |
| Mean earnings (dollars) |
$65,825 |
(X) |
$85,418 |
(X) |
| With Social Security |
3,468 |
21.7 |
73,719 |
32.0 |
| Mean Social Security income (dollars) |
$20,575 |
(X) |
$21,594 |
(X) |
| With retirement income |
2,721 |
17.0 |
53,250 |
23.1 |
| Mean retirement income (dollars) |
$29,909 |
(X) |
$28,437 |
(X) |
| |
|
|
|
|
| With Supplemental Security Income |
467 |
2.9 |
7,729 |
3.4 |
| Mean Supplemental Security Income
(dollars) |
$11,158 |
(X) |
$10,156 |
(X) |
| With cash public assistance income |
176 |
1.1 |
3,746 |
1.6 |
| Mean cash public assistance income
(dollars) |
$3,218 |
(X) |
$3,461 |
(X) |
| With Food Stamp/SNAP benefits |
592 |
3.7 |
11,897 |
5.2 |
| |
|
|
|
|
| Median
Earnings for Full-Time Year-Round Workers - Male |
$51,584 |
(X) |
$60,414 |
(X) |
| Median
Earnings for Full-Time Year-Round Workers - Female |
$43,304 |
(X) |
$41,338 |
(X) |
| |
|
|
|
|
| |
|
|
|
|
| PER CAPITA
INCOME3 |
| Per
capita personal income |
$48,528 |
(X) |
$69,666 |
(X) |
| Per
capita personal current transfer receipts |
$9,169 |
(X) |
$12,268 |
(X) |
| Per
capita dividends, interest, and rent |
$10,171 |
(X) |
$21,023 |
(X) |
| Average
nonfarm proprietors' income |
$22,767 |
(X) |
$39,751 |
(X) |
| |
|
|
|
|
| FAMILIES AND PEOPLE WHOSE INCOME IS BELOW THE POVERTY LEVEL2 |
| All
families |
659 |
8.5 |
9,883 |
6.8 |
| With related children under 18 years |
417 |
12.9 |
7,447 |
11.2 |
| Married
couple families |
394 |
6.4 |
4,039 |
3.4 |
| With related children under 18 years |
236 |
9.5 |
2,181 |
4.6 |
| Families
with female householder, no husband present |
155 |
16.0 |
4,630 |
25.5 |
| With related children under 18 years |
127 |
23.8 |
4,285 |
33.2 |
| |
|
|
|
|
| All
people |
8,245 |
23.6 |
60,482 |
10.7 |
| Under 18 years |
1,136 |
19.6 |
16,807 |
12.8 |
| 18 to 64 years |
6,840 |
27.8 |
36,458 |
10.8 |
| 65 years and over |
269 |
5.9 |
7,217 |
7.6 |
| |
|
|
|
|
| RATIO OF INCOME TO POVERTY LEVEL IN THE PAST 12 MONTHS2 |
| Total: |
34,927 |
100.0 |
563,382 |
100.0 |
| Under .50 |
3,834 |
11.0 |
28,662 |
5.1 |
| .50 to .99 |
4,411 |
12.6 |
31,820 |
5.6 |
| 1.00 to 1.24 |
1,390 |
4.0 |
18,539 |
3.3 |
| 1.25 to 1.49 |
1,518 |
4.3 |
21,520 |
3.8 |
| 1.50 to 1.84 |
1,864 |
5.3 |
33,384 |
5.9 |
| 1.85 to 1.99 |
753 |
2.2 |
15,093 |
2.7 |
| 2.00 and over |
21,157 |
60.6 |
414,364 |
73.5 |
| |
|
|
|
|
| HEALTH
INSURANCE COVERAGE2 |
| Civilian
noninstitutionalized population |
37,145 |
100.0 |
567,043 |
100.0 |
| With health insurance coverage |
34,195 |
92.1 |
500,832 |
88.3 |
| With private health insurance |
29,956 |
80.6 |
412,083 |
72.7 |
| With public coverage |
7,963 |
21.4 |
161,535 |
28.5 |
| No health insurance coverage |
2,950 |
7.9 |
66,211 |
11.7 |
| |
|
|
|
|
| Civilian noninstitutionalized population
under 19 years |
6,807 |
100.0 |
141,812 |
100.0 |
| No health insurance coverage |
327 |
4.8 |
13,231 |
9.3 |
| |
|
|
|
|
| HOUSING
UNITS2 |
| Total
housing units |
18,546 |
100.0 |
271,818 |
100.0 |
| Occupied housing units |
16,016 |
86.4 |
230,653 |
84.9 |
| Owner-occupied |
8,158 |
50.9 |
165,359 |
71.7 |
| Renter-occupied |
7,858 |
49.1 |
65,294 |
28.3 |
| Vacant housing units |
2,530 |
13.6 |
41,165 |
15.1 |
| |
|
|
|
|
| Homeowner vacancy rate |
(X) |
0.9 |
(X) |
1.3 |
| Rental vacancy rate |
(X) |
5.5 |
(X) |
10.8 |
| |
|
|
|
|
| UNITS IN
STRUCTURE2 |
| Total
housing units |
18,546 |
100.0 |
271,818 |
100.0 |
| Single family units |
10,850 |
58.5 |
195,228 |
71.8 |
| 2 to 4 units |
2,622 |
14.1 |
17,406 |
6.4 |
| 5 to 9 units |
1,541 |
8.3 |
9,164 |
3.4 |
| 10 or more units |
1,841 |
9.9 |
15,305 |
5.6 |
| Mobile home |
1,674 |
9.0 |
34,276 |
12.6 |
| RV, van, boat, etc. |
18 |
0.1 |
439 |
0.2 |
| |
|
|
|
|
| RESIDENTIAL
BUILDING PERMITS4 |
| Total
housing units |
138 |
100.0 |
2,706 |
100.0 |
| Single family units |
130 |
94.2 |
2,158 |
79.7 |
| 2 to 4 units |
8 |
5.8 |
261 |
9.6 |
| 5 or more units |
0 |
0.0 |
287 |
10.6 |
| |
|
|
|
|
| HOME VALUE2 |
| Owner-occupied
units |
8,158 |
100.0 |
165,359 |
100.0 |
| Less than $50,000 |
883 |
10.8 |
13,092 |
7.9 |
| $50,000 to $99,999 |
253 |
3.1 |
7,975 |
4.8 |
| $100,000 to $149,999 |
589 |
7.2 |
15,571 |
9.4 |
| $150,000 to $199,999 |
1,038 |
12.7 |
26,731 |
16.2 |
| $200,000 to $299,999 |
2,189 |
26.8 |
47,476 |
28.7 |
| $300,000 to $499,999 |
2,353 |
28.8 |
36,582 |
22.1 |
| $500,000 to $999,999 |
732 |
9.0 |
12,814 |
7.7 |
| $1,000,000 or more |
121 |
1.5 |
5,118 |
3.1 |
| Median (dollars) |
$247,100 |
(X) |
$237,900 |
(X) |
| |
|
|
|
|
| MORTGAGE
STATUS2 |
| Owner-occupied
units |
8,158 |
100.0 |
165,359 |
100.0 |
| Housing units with a mortgage |
4,869 |
59.7 |
96,903 |
58.6 |
| Cost greater than 30% of household
income |
1,094 |
22.5 |
23,098 |
23.8 |
| Housing units without a mortgage |
3,289 |
40.3 |
68,456 |
41.4 |
| Cost greater than 30% of household
income |
388 |
11.8 |
7,253 |
10.6 |
| Median
monthly mortgage cost |
$1,645 |
(X) |
1,536 |
(X) |
| |
|
|
|
|
| GROSS RENT2 |
| Occupied
units paying rent |
7,493 |
100.0 |
59,580 |
100.0 |
| Less than $500 |
795 |
10.6 |
6,923 |
11.6 |
| $500 to $999 |
4,142 |
55.3 |
30,620 |
51.4 |
| $1,000 to $1,499 |
1,795 |
24.0 |
15,353 |
25.8 |
| $1,500 to $1,999 |
600 |
8.0 |
4,714 |
7.9 |
| $2,000 to $2,499 |
115 |
1.5 |
997 |
1.7 |
| $2,500 to $2,999 |
46 |
0.6 |
570 |
1.0 |
| $3,000 or more |
0 |
0.0 |
403 |
0.7 |
| Rent greater than 30% of household
income |
4,471 |
56.9 |
25,126 |
38.5 |
| Median (dollars) |
$851 |
(X) |
$878 |
(X) |
| |
|
|
|
|
| CIVILIAN
LABOR FORCE5 |
| Labor
Force |
20,767 |
100.0 |
290,404 |
100.0 |
| Employment |
20,086 |
96.7 |
277,372 |
95.5 |
| Unemployment |
681 |
3.3 |
13,032 |
4.5 |
| Unemployment
Rate |
3.3% |
(X) |
4.5% |
(X) |
| |
|
|
|
|
| Percent
of population 16 years and over in labor force2 |
(X) |
67.3 |
(X) |
65.8 |
| |
|
|
|
|
| AVERAGE WAGE
AND SALARY EMPLOYMENT6 |
| Total |
16,009 |
100.0 |
265,455 |
100.0 |
| Private |
10,628 |
66.4 |
201,308 |
75.8 |
| Agriculture, Forestry, Fishing,
& Hunting |
69 |
0.4 |
2,722 |
1.0 |
| Mining, Quarrying, & Oil &
Gas Extraction |
47 |
0.3 |
14,755 |
5.6 |
| Utilities |
38 |
0.2 |
2,346 |
0.9 |
| Construction |
804 |
5.0 |
21,008 |
7.9 |
| Manufacturing |
531 |
3.3 |
9,769 |
3.7 |
| Wholesale Trade |
150 |
0.9 |
7,326 |
2.8 |
| Retail Trade |
1,754 |
11.0 |
29,660 |
11.2 |
| Transportation & Warehousing |
183 |
1.1 |
10,044 |
3.8 |
| Information |
79 |
0.5 |
2,962 |
1.1 |
| Financial Activities |
682 |
4.3 |
11,162 |
4.2 |
| Professional & Business Services |
1,345 |
8.4 |
19,646 |
7.4 |
| Educational & Health Services |
2,322 |
14.5 |
27,221 |
10.3 |
| Leisure & Hospitality |
2,188 |
13.7 |
35,803 |
13.5 |
| Other Services |
436 |
2.7 |
6,885 |
2.6 |
| Government |
5,381 |
33.6 |
64,148 |
24.2 |
| Federal Government |
190 |
1.2 |
7,657 |
2.9 |
| State Gov't (inc. higher public
education) |
3,671 |
22.9 |
12,312 |
4.6 |
| Local Gov't (inc. local public
education and hospitals) |
1,519 |
9.5 |
44,178 |
16.6 |
| |
|
|
|
|
| TOTAL ANNUAL
WAGES6 |
| Total |
$726,191,972 |
100.0 |
$14,068,646,917 |
100.0 |
| Private |
$430,356,349 |
59.3 |
$10,572,460,080 |
75.1 |
| Agriculture, Forestry, Fishing,
& Hunting |
$3,227,617 |
0.4 |
$107,905,609 |
0.8 |
| Mining, Quarrying, & Oil &
Gas Extraction |
$2,637,353 |
0.4 |
$1,384,470,642 |
9.8 |
| Utilities |
$3,240,398 |
0.4 |
$234,309,691 |
1.7 |
| Construction |
$38,801,841 |
5.3 |
$1,225,127,150 |
8.7 |
| Manufacturing |
$25,668,520 |
3.5 |
$679,894,229 |
4.8 |
| Wholesale Trade |
$8,679,278 |
1.2 |
$494,650,088 |
3.5 |
| Retail Trade |
$51,533,516 |
7.1 |
$993,828,016 |
7.1 |
| Transportation & Warehousing |
$8,159,961 |
1.1 |
$573,260,680 |
4.1 |
| Information |
$4,006,953 |
0.6 |
$183,262,800 |
1.3 |
| Financial Activities |
$36,728,001 |
5.1 |
$835,827,294 |
5.9 |
| Professional & Business Services |
$78,968,176 |
10.9 |
$1,394,476,631 |
9.9 |
| Educational & Health Services |
$113,505,610 |
15.6 |
$1,294,802,854 |
9.2 |
| Leisure & Hospitality |
$39,152,123 |
5.4 |
$880,900,581 |
6.3 |
| Other Services |
$16,047,002 |
2.2 |
$289,743,815 |
2.1 |
| Government |
$295,835,623 |
40.7 |
$3,496,186,837 |
24.9 |
| Federal Government |
$12,009,642 |
1.7 |
$560,789,166 |
4.0 |
| State Gov't (inc. higher public
education) |
$219,600,718 |
30.2 |
$714,420,469 |
5.1 |
| Local Gov't (inc. local public
education and hospitals) |
$64,225,263 |
8.8 |
$2,220,977,202 |
15.8 |
| |
|
|
|
|
| AVERAGE
ANNUAL WAGE6 |
| Total |
$45,362 |
100.0 |
$52,998 |
100.0 |
| Private |
$40,494 |
89.3 |
$52,519 |
99.1 |
| Agriculture, Forestry, Fishing,
& Hunting |
$46,723 |
103.0 |
$39,642 |
74.8 |
| Mining, Quarrying, & Oil &
Gas Extraction |
$56,414 |
124.4 |
$93,834 |
177.1 |
| Utilities |
$86,411 |
190.5 |
$99,887 |
188.5 |
| Construction |
$48,271 |
106.4 |
$58,318 |
110.0 |
| Manufacturing |
$48,355 |
106.6 |
$69,599 |
131.3 |
| Wholesale Trade |
$57,831 |
127.5 |
$67,517 |
127.4 |
| Retail Trade |
$29,382 |
64.8 |
$33,507 |
63.2 |
| Transportation & Warehousing |
$44,529 |
98.2 |
$57,077 |
107.7 |
| Information |
$50,612 |
111.6 |
$61,863 |
116.7 |
| Financial Activities |
$53,879 |
118.8 |
$74,885 |
141.3 |
| Professional & Business Services |
$58,701 |
129.4 |
$70,982 |
133.9 |
| Educational & Health Services |
$48,877 |
107.7 |
$47,566 |
89.7 |
| Leisure & Hospitality |
$17,897 |
39.5 |
$24,604 |
46.4 |
| Other Services |
$36,770 |
81.1 |
$42,085 |
79.4 |
| Government |
$54,978 |
121.2 |
$54,502 |
102.8 |
| Federal Government |
$63,069 |
139.0 |
$73,242 |
138.2 |
| State Gov't (inc. higher public
education) |
$59,814 |
131.9 |
$58,024 |
109.5 |
| Local Gov't (inc. local public
education and hospitals) |
$42,277 |
93.2 |
$50,273 |
94.9 |
| |
|
|
|
|
| COMMUTING TO OR FROM A DIFFERENT COUNTY OR STATE FOR WORK7 |
| Total
Commuting Out |
3,793 |
100.0 |
14,338 |
5.8 |
| to Laramie County, WY |
1,435 |
37.8 |
(X) |
(X) |
| to Natrona County, WY |
321 |
8.5 |
(X) |
(X) |
| to Larimer County, CO |
282 |
7.4 |
(X) |
(X) |
| to Weld County, CO |
193 |
5.1 |
(X) |
(X) |
| to Carbon County, WY |
176 |
4.6 |
(X) |
(X) |
| to Campbell County, WY |
138 |
3.6 |
(X) |
(X) |
| to Sweetwater County, WY |
95 |
2.5 |
(X) |
(X) |
| to Platte County, WY |
90 |
2.4 |
(X) |
(X) |
| to Fremont County, WY |
67 |
1.8 |
(X) |
(X) |
| to All Other Locations |
996 |
26.3 |
(X) |
(X) |
| |
|
|
|
|
| Total
Commuting In |
3,888 |
100.0 |
24,601 |
9.5 |
| from Laramie County, WY |
1,177 |
30.3 |
(X) |
(X) |
| from Natrona County, WY |
504 |
13.0 |
(X) |
(X) |
| from Larimer County, CO |
220 |
5.7 |
(X) |
(X) |
| from Fremont County, WY |
199 |
5.1 |
(X) |
(X) |
| from Carbon County, WY |
159 |
4.1 |
(X) |
(X) |
| from Campbell County, WY |
120 |
3.1 |
(X) |
(X) |
| from Sheridan County, WY |
106 |
2.7 |
(X) |
(X) |
| from Platte County, WY |
97 |
2.5 |
(X) |
(X) |
| from Weld County, CO |
89 |
2.3 |
(X) |
(X) |
| from All Other Locations |
1,217 |
31.3 |
(X) |
(X) |
| Commuting data are not comparable in profiles prior to the 2020
County Profiles because their source and methodology are different. |
| |
|
|
|
|
| AGRICULTURE8 |
| Number
of Farms (2017) |
451 |
(X) |
11,938 |
(X) |
| Land in
Farms (thousands of acres) (2017) |
1,407 |
(X) |
29,005 |
(X) |
| Total
Cash Receipts (thousands of dollars) |
$57,319 |
100.0 |
$1,739,216 |
100.0 |
| Livestock and Products |
$47,370 |
82.6 |
$1,288,079 |
74.1 |
| Crops |
$9,949 |
17.4 |
$451,137 |
25.9 |
| Net
Farm Income (thousands of dollars) |
$9,687 |
(X) |
$287,560 |
(X) |
| |
|
|
|
|
| VALUATION
AND TAXES9 |
| Total
Assessed Valuation |
$573,516,444 |
100.0 |
$26,532,077,654 |
100.0 |
| Non-Minerals |
$562,764,625 |
98.1 |
$14,630,528,293 |
55.1 |
| Agricultural Land |
$12,993,447 |
2.3 |
$366,197,380 |
1.4 |
| Residential Property |
$350,800,563 |
61.2 |
$8,183,591,623 |
30.8 |
| Commercial Property |
$110,173,629 |
19.2 |
$2,058,392,384 |
7.8 |
| Industrial Property |
$26,458,017 |
4.6 |
$2,090,925,846 |
7.9 |
| Other (Electric, Pipelines,
Railroads, etc.) |
$62,338,969 |
10.9 |
$1,931,421,060 |
7.3 |
| Minerals |
$10,751,819 |
1.9 |
$11,901,549,361 |
44.9 |
| Oil |
$733,177 |
0.1 |
$5,017,956,556 |
18.9 |
| Natural gas |
$0 |
0.0 |
$4,089,422,104 |
15.4 |
| Coal |
$0 |
0.0 |
$2,239,399,153 |
8.4 |
| Other minerals |
$10,018,642 |
1.7 |
$554,771,548 |
2.1 |
| Total
Property Taxes |
$40,715,921 |
(X) |
$1,728,301,129 |
(X) |
| Average
Mill Levy |
71.0 |
(X) |
65.1 |
(X) |
| |
|
|
|
|
| 4% SALES AND
USE TAX COLLECTIONS10 |
| Total |
$30,153,764 |
100.0 |
$807,533,179 |
100.0 |
| Agriculture, Forestry, Fishing, &
Hunting |
$32,193 |
0.1 |
$252,095 |
0.0 |
| Mining, Quarrying, & Oil & Gas
Extraction |
$325,507 |
1.1 |
$74,939,687 |
9.3 |
| Utilities |
$1,083,903 |
3.6 |
$36,268,698 |
4.5 |
| Construction |
$500,364 |
1.7 |
$13,622,600 |
1.7 |
| Manufacturing |
$450,114 |
1.5 |
$23,058,278 |
2.9 |
| Wholesale Trade |
$1,079,739 |
3.6 |
$50,714,454 |
6.3 |
| Retail Trade |
$15,183,909 |
50.4 |
$338,026,875 |
41.9 |
| Transportation & Warehousing |
$107,036 |
0.4 |
$3,489,360 |
0.4 |
| Information |
$460,508 |
1.5 |
$11,678,036 |
1.4 |
| Financial Activities (inc. auto,
machinery, and equip. leasing) |
$691,803 |
2.3 |
$31,675,389 |
3.9 |
| Professional & Business Services |
$406,535 |
1.3 |
$6,220,639 |
0.8 |
| Educational & Health Services |
$216,102 |
0.7 |
$448,819 |
0.1 |
| Leisure & Hospitality |
$4,895,281 |
16.2 |
$101,401,201 |
12.6 |
| Other Services |
$922,086 |
3.1 |
$30,220,774 |
3.7 |
| Public Administration (reflects
automobile sales) |
$3,798,683 |
12.6 |
$85,516,274 |
10.6 |
| |
|
|
|
|
| LANDOWNERSHIP11 (square
miles) |
| Total
Area |
4,308.8 |
100.0 |
97,809.8 |
100.0 |
| Private
Lands |
2,901.8 |
67.3 |
42,018.3 |
43.0 |
| Conservation Easement |
84.1 |
2.0 |
913.9 |
0.9 |
| Federal
Lands |
1,055.8 |
24.5 |
46,587.5 |
47.6 |
| Forest Service |
585.9 |
13.6 |
14,397.1 |
14.7 |
| BLM |
461.9 |
10.7 |
27,333.0 |
27.9 |
| National Park Service |
0.0 |
0.0 |
3,641.0 |
3.7 |
| Military |
0.0 |
0.0 |
79.0 |
0.1 |
| Other Federal |
8.0 |
0.2 |
1,137.5 |
1.2 |
| State
Lands |
350.0 |
8.1 |
6,034.2 |
6.2 |
| State Trust Lands* |
298.6 |
6.9 |
5,560.3 |
5.7 |
| Other State |
51.4 |
1.2 |
473.9 |
0.5 |
| Tribal
Lands |
0.0 |
0.0 |
3,143.3 |
3.2 |
| City,
County, Other |
1.2 |
0.0 |
26.5 |
0.0 |
| * Trust lands are held in trust for designated beneficiaries,
principally public schools. Managers may lease and sell these lands for a
diverse range of uses to generate revenues for the beneficiaries. |
| |
|
|
|
|
| PUBLIC
SCHOOL STATISTICS12 |
| Number
of School Districts |
1 |
(X) |
48 |
(X) |
| Number
of Schools |
17 |
(X) |
343 |
(X) |
| Fall
Enrollment |
3,946 |
(X) |
92,756 |
(X) |
| Composite
ACT score (Grade 11) (2020-2021) |
19.3 |
(X) |
18.6 |
(X) |
| High
School Graduates (4 year on time) |
260 |
(X) |
5,881 |
(X) |
| Graduation Rate |
86.4% |
(X) |
81.8% |
(X) |
| Average
Daily Membership (ADM) |
3,849 |
(X) |
90,642 |
(X) |
| Certified
Teachers |
342 |
(X) |
7,239 |
(X) |
| Certified
Staff |
81 |
(X) |
1,671 |
(X) |
| Administration |
29 |
(X) |
761 |
(X) |
| Classified
Staff |
255 |
(X) |
6,668 |
(X) |
| Students
Transported Daily |
782 |
(X) |
27,693 |
(X) |
| Total
General Fund Revenues |
$61,327,308 |
(X) |
$1,658,014,808 |
(X) |
| Total
General Fund Expenditures |
$63,583,050 |
(X) |
$1,537,004,416 |
(X) |
| Operating
Cost Per ADM |
$19,336 |
(X) |
$19,918 |
(X) |
| Percent
of Students with Free or Reduced Lunch (2022-2023) |
24.0% |
(X) |
34.0% |
(X) |
| |
|
|
|
|
| TRANSPORTATION13 |
| Number
of Registered Vehicles |
42,763 |
100.0 |
929,395 |
100.0 |
| Passenger Cars |
20,180 |
47.2 |
357,120 |
38.4 |
| Trucks |
11,334 |
26.5 |
267,071 |
28.7 |
| Motorcycles |
1,140 |
2.7 |
26,878 |
2.9 |
| Trailers (including house trailers) |
8,129 |
19.0 |
216,140 |
23.3 |
| University of Wyoming Specialty Plates
(cars & trucks) |
497 |
1.2 |
6,697 |
0.7 |
| Commercial Trucks & Trailers |
375 |
0.9 |
20,798 |
2.2 |
| Others |
1,108 |
2.6 |
34,691 |
3.7 |
| Road
(miles) |
|
|
30,247 |
100.0 |
| Federal* |
NA |
(X) |
5,938 |
19.6 |
| State Highway |
312 |
(X) |
6,733 |
22.3 |
| County Road |
575 |
(X) |
14,597 |
48.3 |
| Local (City & Town) |
147 |
(X) |
2,483 |
8.2 |
| Other |
4 |
(X) |
496 |
1.6 |
| Per
Capita Vehicle Miles Traveled (2021) |
13,901 |
(X) |
16,078 |
(X) |
| Mean
travel time to work (minutes)2 |
13.9 |
(X) |
18.1 |
(X) |
| Commercial
Airport Passengers (2022) |
31,025 |
(X) |
1,224,613 |
(X) |
NA - Not Available
*Federal Miles not available by County. |
| |
|
|
|
|
| HEALTH CARE
AND RISK FACTORS14 |
| Licensed
Hospitals |
1 |
(X) |
27 |
(X) |
| Bed Capacity |
99 |
(X) |
1,416 |
(X) |
| Licensed
Nursing Care Facilities |
1 |
(X) |
35 |
(X) |
| Bed Capacity |
105 |
(X) |
2,905 |
(X) |
| Occupancy Rate |
51.0% |
(X) |
67.9% |
(X) |
| Medicaid
Beneficiaries (2021) |
3,278 |
8.7 |
74,757 |
12.9 |
| Enrollment
in State Children Health Insurance Program (2021) |
214 |
3.1 |
6,133 |
4.3 |
| Percent of Adults with BMI (weight in kg/height in meters
squared) Larger Than 30 (2017-2021) |
24.5% |
(X) |
32.0% |
(X) |
| Percent of Adults who reported having 5 or more drinks on
an occasion at least once in the past 30 days (2017-2021) |
24.1% |
(X) |
15.9% |
(X) |
| Percent of Adults who reported having smoked at least 100
cigarettes in their lifetime and are currently smoking
(2017-2021) |
10.6% |
(X) |
16.4% |
(X) |
|
|
|
|
|
| SOURCES: |
|
|
|
|
|
| 1 U.S. Census Bureau, Population Division,
2021 |
7 U.S. Census
Bureau, LEHD Origin-Destination Employment |
| Population data is not comparable to
figures in prior profiles |
Statistics,
2020 |
|
|
|
| because the base data is different.
Current population data is |
8 U.S. Department
of Agriculture and U.S. Bureau of Economic |
| based on the 2020 Census, where previously
the base was the |
Analysis, 2021 |
|
|
|
| 2010 Census. |
9 Wyoming Department of Revenue, 2022 |
|
| 2 U.S. Census
Bureau, 2017-2021 American Community Survey |
10 Wyoming Department of Revenue, Fiscal Year
2022 |
|
| 5-Year Estimates |
11 U.S. Geological Survey, GAP Analysis
Program, 2018 |
|
| 3 U.S. Bureau of
Economic Analysis, 2021 |
12 Wyoming Department of Education, 2021 |
|
| 4 U.S. Census
Bureau, Building Permits Survey, 2021 |
13 Wyoming Department of Transportation, 2022 |
|
| 5 U.S. Bureau of Labor Statistics, Local Area
Unemployment |
14 Wyoming Department of Health and Wyoming
Department of |
| Statistics, 2021 |
Family Services, 2022 |
|
|
| 6 Wyoming Department of Workforce Services and
U.S. Bureau |
|
|
|
|
| of Labor Statistics, Quarterly Census of
Employment and |
|
|
|
|
| Wages, 2021 |
|
|
|
|
|
|
|
|
|